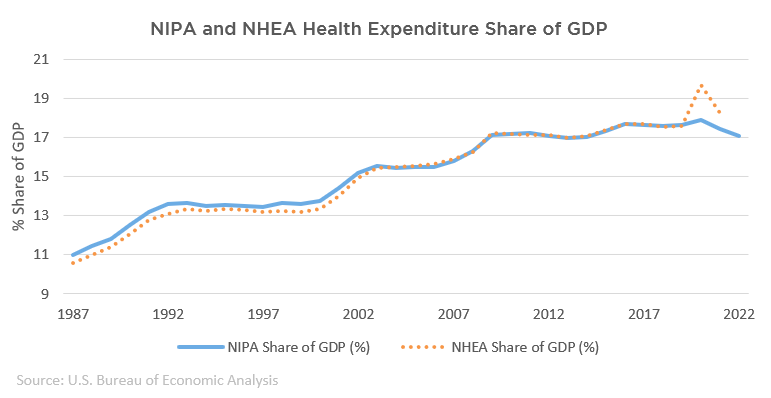
Today BEA is introducing new experimental data that map our health care estimates in gross domestic product to the framework of CMS’ National Health Expenditures Account, allowing researchers to get an earlier look at 2022 health care spending numbers. The experimental data show health care spending in 2022 rose to more than $4.3 trillion, while the share of GDP declined to 17.1 percent, from a 17.5 percent share in 2021.
Policymakers, researchers, and the public rely on economic measures to help understand, evaluate, and respond to health care trends. The new data set, called BEA Data Applying NHEA Framework, provides a timelier snapshot of health care spending in a form comparable to the Centers for Medicare & Medicaid Services’ widely used and more-detailed NHEA data, which are not yet available for 2022.
CMS produces the nation’s official estimates of health care spending, with data on both place of service and payer. The Bureau of Economic Analysis estimates health care spending as part of GDP, without regard to payer, as part of producing internationally comparable measures of national economies’ size and growth. The methodologies differ but the statistics are similar – both show the health care sector’s share of GDP rising from around 13 percent in 2000 to about 18 percent in 2021.
The NHEA and BEA’s regular health care statistics use many of the same underlying data sources, but differences in methodology and framework lead to differences in the estimates. In prior reconciliations of the two, noticeable divergence came from differing treatment of manufacturer rebates that reduce insurers’ payments for prescription drugs. However, in BEA’s new experimental data set, the removal of manufacturer rebates from prescription spending greatly closes the divergence between BEA and NHEA data.
Using BEA’s experimental data, the two estimates track closely from 1987 to 2021, except for 2020, which reflects methodological differences in accounting for government funds related to COVID-19.
Still, the NHEA is unique from BEA data in important ways. Most notably, the NHEA estimates include additional detail that breaks spending out by payer, including Medicare, Medicaid, commercial payers such as insurance companies, and people’s out-of-pocket spending.
For more information about the differences between BEA and NHEA estimates, see “A Reconciliation of Health Care Expenditures in the National Health Expenditures Accounts and in Gross Domestic Product.”
Updated Sept. 28, 2023: The share of GDP was updated to reflect total BEA health expenditure as a fraction of total GDP.
