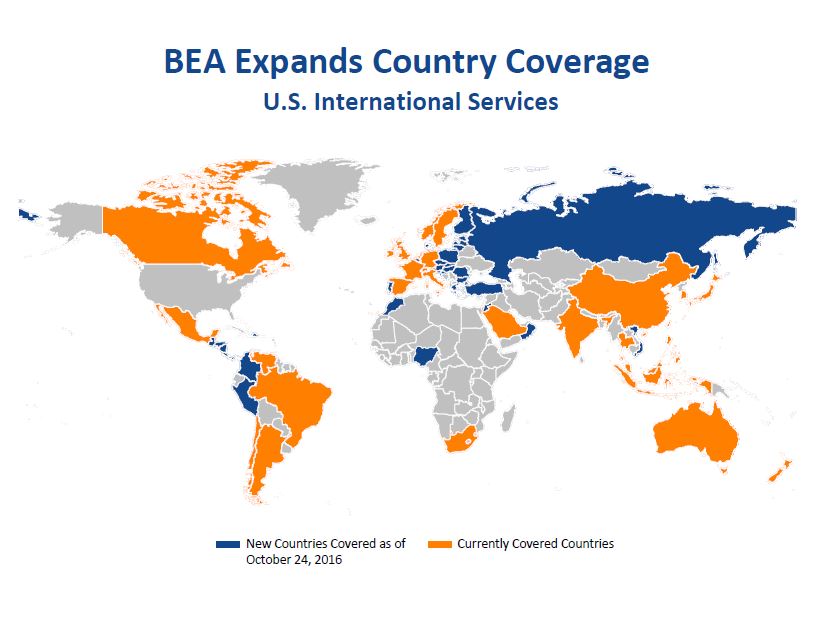
How much do U.S. residents spend on travel to Greece? How much does the U.S. export in movies and television programming to Vietnam? You can answer these questions next week when the Bureau of Economic Analysis expands the geographic detail it publishes on U.S. imports and exports of services. On October 24, we will publish annual statistics on international trade in services with 90 countries and areas, up from 49.
Previously, BEA included services trade with these countries in its overall trade statistics but did not publish country-by-country detail for them. Russia, Austria, Nigeria, and Colombia are among the countries that will soon be available. Also included are all countries that have free trade agreements either in force or under negotiation with the United States. A full list can be found here.

The new geographic detail released this month will include statistics for 2013 through 2015.
The expanded geographic detail comes on the heels of the release of new data on trade in information and communications technology services and in services that could be delivered using those technologies (sometimes referred to as digitally-enabled services). These statistics were first presented in the May 2016 issue of Survey of Current Business.
To present this additional detail, changes are coming to the structure of several International Services accounts tables. Tables 2.2 and 2.3, which provide statistics on U.S. services trade by country and by type of service, are being expanded to incorporate the additional country detail. Tables 3.1 to 3.3 are new tables for the statistics on services trade related to information and communications technology. The structure of former tables 3.1 to 4.3, which provide statistics on services supplied through affiliates, will not change, but they will be renumbered to 4.1 to 5.3. Drafts of the new table presentations can be previewed in BEA’s Interactive Data Application.