News Release
Gross Domestic Product by Industry: Second Quarter 2018
Comprehensive Update: 1997 Through First Quarter 2018
Information; real estate and rental and leasing; and professional, scientific, and technical services were the leading contributors to the increase in U.S. economic growth in the second quarter of 2018. According to gross domestic product (GDP) by industry statistics released by the Bureau of Economic Analysis, 16 of 22 industry groups contributed to the overall 4.2 percent increase in real GDP in the second quarter.
- For the information services industry group, real value added—a measure of an industry’s contribution to GDP—increased 13.4 percent in the second quarter, after increasing 4.3 percent in the first quarter. The second quarter growth primarily reflected an increase in data processing, internet publishing, and other information services.
- Real estate and rental and leasing increased 5.3 percent, after increasing 2.7 percent. The second quarter growth primarily reflected increases to other real estate, which includes offices of real estate agents and brokers, as well as housing.
- Professional, scientific, and technical services increased 9.3 percent, after increasing 6.0 percent. The second quarter growth primarily reflected an increase in miscellaneous professional, scientific, and technical services, which includes advertising and research and development services.
Other highlights
- Real GDP growth accelerated to 4.2 percent in the second quarter, up from 2.2 percent in the first quarter. Mining was the leading contributor to the acceleration in real GDP growth in the second quarter. Real value added for the industry group increased 11.7 percent, after decreasing 18.0 percent in the first quarter.
- Health care and social assistance increased 4.7 percent, after increasing 4.6 percent, primarily reflecting an increase in ambulatory health care services.
- Durable goods manufacturing increased 7.3 percent, after increasing 4.7 percent. The second quarter increase was primarily attributed to motor vehicles, bodies and trailers, and parts manufacturing.
Gross output by industry
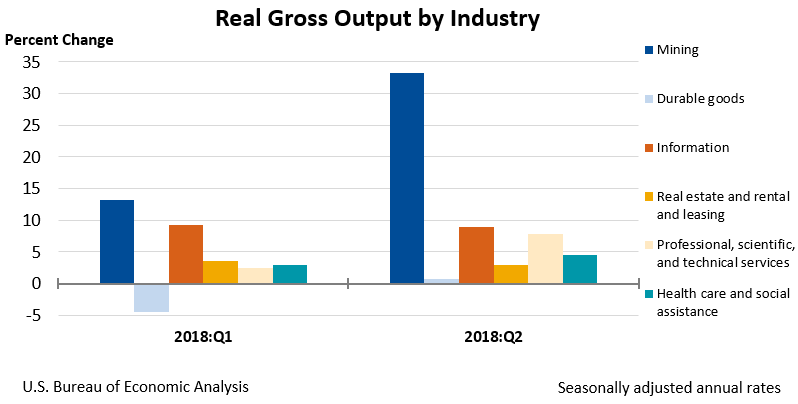
Economy-wide, real gross output—principally a measure of an industry’s sales or receipts, which includes sales to final users in the economy (GDP) and sales to other industries (intermediate inputs)—increased 4.0 percent in the second quarter. This reflected an increase of 3.6 percent for the private goods-producing sector, 4.6 percent for the private services-producing sector, and 1.5 percent for the government sector. Overall, 21 of 22 industry groups contributed to the increase in real gross output.
- Real gross output for mining increased 33.2 percent in the second quarter, after increasing 13.2 percent in the first quarter. This was the largest increase since the first quarter of 2017 and was primarily attributed to oil and gas extraction.
- Information increased 8.9 percent, after increasing 9.2 percent, primarily reflecting increases in data processing, internet publishing, and other information services, as well as motion picture and sound recording industries.
- Health care and social assistance increased 4.5 percent, after increasing 2.9 percent. This industry has increased for four consecutive quarters.
Comprehensive Update of the Industry Economic Accounts
The estimates released today reflect the results of the comprehensive update of the Industry Economic Accounts. The comprehensive update includes revised quarterly estimates beginning with the first quarter of 2005 and annual statistics revised back to 1997. The update incorporates source data that are more complete and reliable than those previously available. Major improvements introduced with this update include:
- Updated industry and commodity definitions consistent with the 2012 North American Industry Classification System (NAICS).
- The results of the 2012 benchmark supply-use tables (SUTs) that incorporate U.S. Census Bureau data on shipments, receipts, and business expenses from the 2012 Economic Census, Business Expenses Supplement, and Service Annual Survey (SAS).
- Incorporation of results from the 2018 comprehensive update of the National Income and Product Accounts, including improved deflation of software, medical equipment, and communications equipment, and the reclassification of research and development (R&D) for software originals from own-account software to R&D.
- A shift in emphasis toward SUTs consistent with international recommendations from the 2008 System of National Accounts (SNA).
- Introduction of more detailed annual data on value added, gross output, and intermediate inputs at roughly the four-digit NAICS level of detail (138 industries) as part of the underlying detail for the Industry Economic Accounts.
- Incorporation of newly available and revised source data (including the Census Bureau’s Service Annual Survey, the Bureau of Labor Statistics’ Quarterly Census of Employment and Wages, and the Department of Treasury’s Statistics of Income).
Benchmark and annual supply-use tables, as well as the full set of GDP by industry results can be found on the BEA Web site. The updated estimates reflect previously announced improvements. Additional information will be available in an article in the December 2018 issue of the Survey of Current Business.
***
Next release — January 24, 2019 at 8:30 A.M. EST for:
Gross Domestic Product by Industry: Third Quarter 2018
