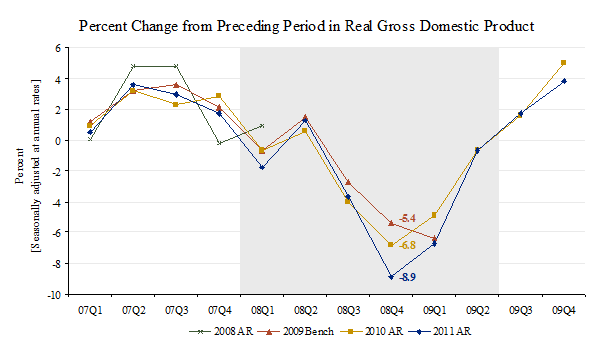
The revised estimates of GDP that were released on July 29, 2011, as part of the annual revision of the national income and product accounts (NIPAs) indicate that the depth of the 2007–2009 recession was deeper, and the subsequent period of expansion was somewhat less robust.
The revised estimates show that for the period of contraction from 2007:Q4 to 2009:Q2, real GDP decreased at an average annual rate of 3.5 percent; in the previously published estimates, it had decreased at a rate of 2.8 percent. The cumulative decrease over the six quarters of contraction is now estimated as 5.1 percent, compared with 4.1 percent in the previously published estimates; both the revised and previously published estimates of GDP show that the recession was the deepest contraction since the beginning of BEA’s quarterly real GDP estimates in 1947.
The revisions did not change the timing of the contraction. The overall pattern of quarterly changes during the downturn was similar in both the revised and previously published estimates, though the revised estimates show larger decreases for 2008:Q4 (-8.9 percent compared with -6.8 percent) and for 2009:Q1 (-6.7 percent compared with -4.9 percent). The contributions of specific GDP components to the contraction were similar in both the revised and previously published estimates. (See the briefing on results of the 2011 NIPA annual revision.)
For the period of expansion from 2009:Q2 to 2011:Q1, real GDP increased at an average annual rate of 2.6 percent; in the previously published estimates, the average increase in real GDP during the first seven quarters of the three previous expansions that began in 1982:Q1, in 1991:Q1, and in 2001:Q3 was 3.3 percent (annual rate).
BEA revises GDP during annual revisions because new and revised source data become available that are more comprehensive, more accurate, and more detailed than the source data that were available for the earlier estimates. Some examples of newly available source data from the Census Bureau that were incorporated in the 2011 annual revision include the 2009 Annual Survey of Manufactures, 2009 Annual Retail Trade Survey, and 2010 Service Annual Survey. For more information on the sources of this year’s revisions, a table showing revisions and major source data is available. Also, an article in the August Survey discusses the results of this year’s revision in more detail.
Recessions pose significant challenges to the accuracy of economic indicators, including those that are used as source data for the early GDP estimates. During recessions, some firms go out of business, some may only partially complete surveys, and some may choose to not respond at all to voluntary surveys. In addition, for BEA’s earliest, or “advance” GDP estimates, some source data are available for only two months, and BEA makes assumptions for the missing data. For example, BEA’s advance estimate of GDP for 2008:Q4, which was released on January 30, 2009, showed a decrease of 3.8 percent at an annual rate, whereas the second estimate, which was released on February 27, 2009, showed a decrease of 6.2 percent. (For more information on the revisions to 2008:Q4, see the FAQ “Why has the initial estimate of real GDP for the fourth quarter of 2008 been revised down so much?”)
The revisions to GDP reflect revised or newly available data from the Census Bureau, Bureau of Labor Statistics, and other statistical agencies. For example, in the annual revision of monthly retail and food services that was released by the Census Bureau on April 29, 2011, total retail sales for 2009 were revised down 0.9 percent, reflecting newly available data from the 2009 Annual Retail Trade Survey. These revisions are also reflected in the GDP estimates for personal consumption expenditures for goods. Similarly, in the benchmark revisions to the BLS employment data that were released in February 2010, total nonfarm employment for March 2009 was revised down 0.7 percent (source), and this revision is reflected in BEA’s estimates of wages and salaries.
BEA judges the accuracy of its early estimates by whether they present the same general picture of economic activity as its latest estimates in terms of long-term growth rates, trends in key components of GDP, broad features of the business cycle, including the timing and depth of recessions, the strength of recoveries, the major components contributing to growth and to contractions, and the pattern of quarterly growth. For information on the reliability of the GDP estimates according to these criteria, see the FAQ, “How reliable are BEA's early GDP estimates and revisions?,” and the recent study published in the July 2011 Survey of Current Business. Compared with other countries, early estimates of U.S. GDP are among the most timely and accurate in the world.
The chart below shows the revisions to the quarterly estimates of percent changes in real GDP for the three most recent annual revisions and the 2009 benchmark revision of the NIPAs.

(The shaded area marks the beginning and end of the 2007-2009 recession as determined by the Business Cycle Dating Committee of the National Bureau of Economic Research)